Analytics dashboard
Note
Only Enterprise customers have access to the analytics dashboard.
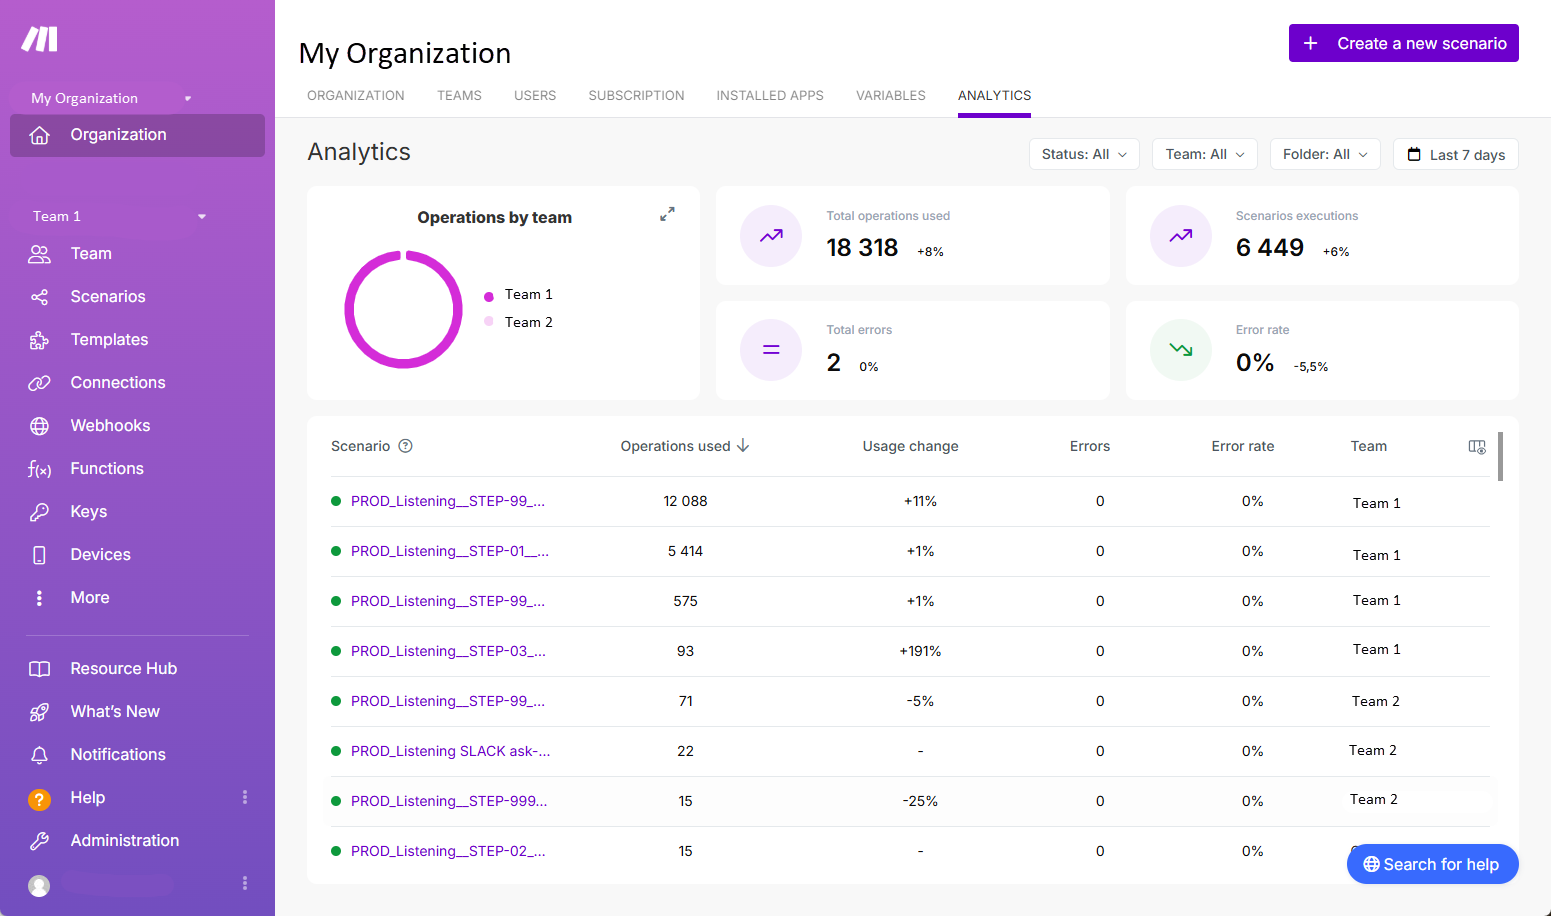
The Analytics dashboard gives you a clear view of your account's key metrics. You can easily see what's happening across all your scenarios, so you can stay on top of things and make informed decisions to optimize performance.
Dashboard features
The top of the dashboard shows key metrics for your organization:
operations by team
total operations used
total errors
error rate
scenario executions
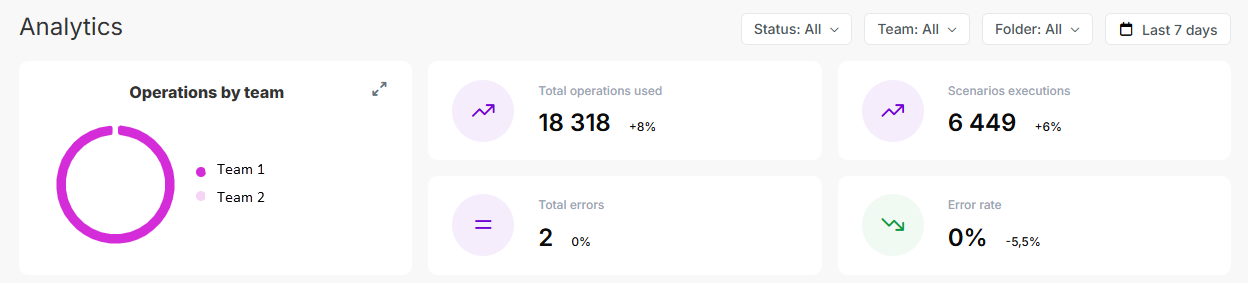
Next to each of these metrics is an icon, showing how the metric is trending. For example, a down arrow next to the error rate indicates a decreasing error rate within the indicated time frame.
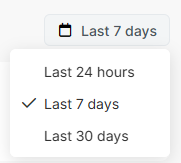
You can change the time frame to view statistics for the last 24 hours, 7 days, or 30 days, allowing for more precise analytics.
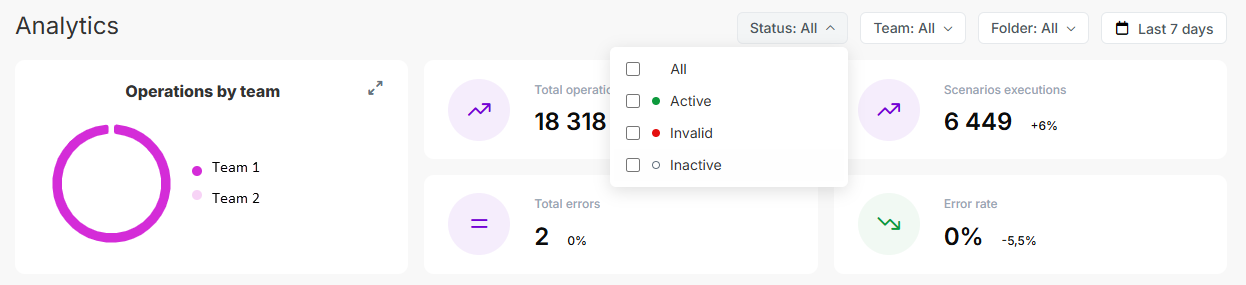
Additional filters include Status, Team, and Folder. The values available under Team and Folder vary, depending on the setup of your organization.
By default, scenarios are listed according to the number of operations used in the selected time frame.
You can further customize the display by choosing the columns you want to view for each scenario.
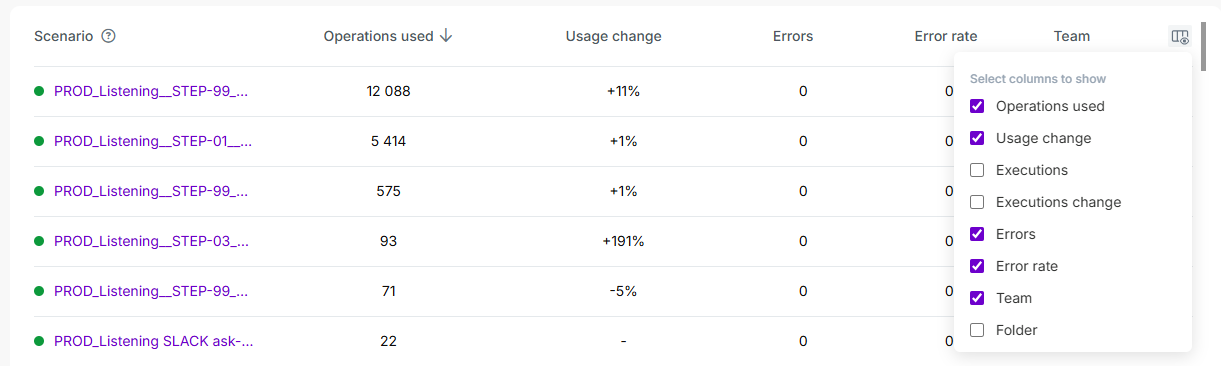
Column | Description |
|---|---|
Scenario | Only existing scenarios are shown. Data for deleted scenarios is unavailable.
|
Operations used | The total number of operations used by a scenario in the selected time frame. |
Usage change | The percentage change in operations used by a scenario, compared to the previous time frame. |
Executions | The total number of executions in a scenario in the selected time frame. |
Executions change | The percentage change in executions for a scenario, compared to the previous time frame. |
Errors | The total number of errors in a scenario in the selected time frame. |
Error rate | The percentage of executions with errors in a scenario in the selected time frame. |
Team | The team associated with a scenario. |
Folder | The folder associated with a scenario. |